Spreadsheet Practice - Fishing
Directions: The tables below represents the number of fish caught by several young men for the month of May. Illustrate this information in the table into a bar-graph using a spreadsheet program.
Number of Fish Caught in May |
|||||
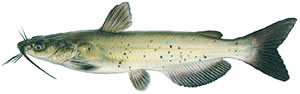
Catfish |
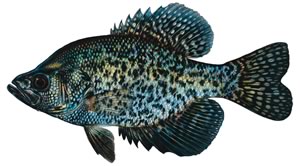
Crappie |
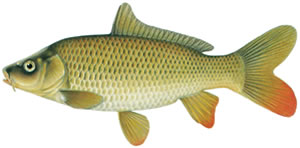
Carp |
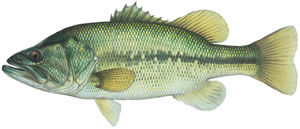
Bass | Total |
|
| Sydney | |||||
| Morgan | |||||
| Hunter | |||||
| Seth | |||||
| Jaclyn | |||||
| Kris | |||||
| Sam | |||||
| Haley R | |||||
| Haley S | |||||
| Kayden | |||||
| Addison | |||||
| Total | |||||
- Start your spreadsheet program.
- Save the assignment in your Excel folder as: Excel_practice_fishing
- Enter the information from the table above into your spreadsheet.
- You are to add a totals column and row to show how many total fish each person caught as well as the total number of each type of fish caught. Be sure and use formulas.
- Use your chart program to convert the data into a bar graph.
- Insert a header on your page which includes your name, date and assignment.
- Save as pdf with your paper landscape fit to one page.
 |
 |
 |
 |
Catfish |
Black Crappie |
Carp |
Largemouth Bass |